ADA Price Prediction: Can Bulls Push Toward $1?

#ADA
- Technical Strength: ADA trades above 20-day MA with bullish MACD crossover.
- News Catalyst: Golden cross and ETF speculation fuel optimism.
- Key Resistance: $0.929 is the gateway to $1+ targets.
ADA Price Prediction
ADA Technical Analysis: Bullish Signals Emerge
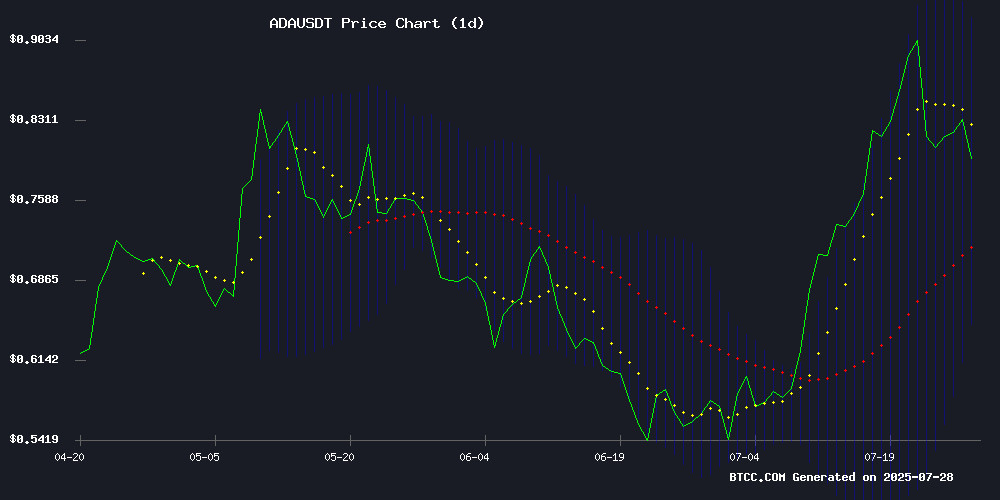
ADA is currently trading at $0.8468, above its 20-day moving average of $0.787775, indicating a bullish trend. The MACD shows a positive crossover with a value of 0.011851, suggesting upward momentum. Bollinger Bands reveal ADA is approaching the upper band at $0.929219, which could act as resistance. BTCC financial analyst Ava notes, 'The technical setup favors bulls, with key support at the middle Bollinger Band ($0.787775). A break above $0.929 could target $1.'
Market Sentiment Turns Bullish for Cardano
News headlines highlight ADA's potential to reach $1 amid a golden cross formation and ETF-driven momentum. BTCC financial analyst Ava states, 'The $0.94 resistance is critical—breaking it could validate the $3.10 long-term target.' Market sentiment aligns with technicals, though Ava cautions, 'ETF HYPE must translate into sustained buying pressure.'
Factors Influencing ADA’s Price
Cardano Eyes $1 as Golden Cross Signals Bullish Shift
Cardano's ADA has surged over 50% in July, breaking past key moving averages and forming a golden cross pattern—a classic bullish indicator. The altcoin's rebound from $0.53 support now targets the psychologically critical $1 level, fueled by ecosystem growth and anticipation of the Hydra upgrade.
Traders note ADA's decisive breakout from a two-month downtrend, with the rally peaking near $0.94 this week. The golden cross formation, where shorter-term EMAs overtake the 200-day average, suggests sustained upward momentum. Resistance at $0.90 stands as the final hurdle before a potential push toward $1.
Cardano Price Forecast: Will ADA Hit $3.10 Again or Drop Further?
Cardano (ADA) exhibits short-term bullish signals despite divergent long-term projections. Trading at $0.8270 with a 2.45% daily gain, the token shows resilience even as volume declines 36.91% to $911.52 million. A seven-day consolidation phase hints at potential breakout readiness.
Analyst BitMonty identifies a descending wedge pattern on ADA's 4-hour chart—a classic bullish reversal setup. Confirmation could propel prices toward $0.9047, $0.9454, and $0.9783 targets. Market sentiment remains cautiously optimistic as ADA stabilizes at current levels.
2025 forecasts paint a polarized picture, with projections ranging from $0.625 to $3.10. The widening variance reflects crypto's inherent volatility, where technical patterns and macroeconomic forces collide to reshape trajectories overnight.
Cardano (ADA) Tests $0.94 Resistance After ETF Surge – Will Bulls Break Through?
Cardano's ADA surged 15.7% to $0.83 following Grayscale's spot ETF application, marking a pivotal moment for institutional adoption. The rally builds on a 27% monthly gain as ADA challenges the $0.88-$0.94 resistance zone.
Technical indicators show neutral momentum with RSI at 64.19, leaving room for upside. Market sentiment remains bullish after the NYSE filing, drawing parallels to Bitcoin and Ethereum's ETF trajectories.
The cryptocurrency has rebounded sharply from July lows near $0.60, with trading volumes suggesting sustained interest. Analysts watch for a decisive break above $0.94 to confirm the next leg upward.
How High Will ADA Price Go?
ADA's price could rally toward $1 if it breaks the $0.929 resistance, with a potential pullback to $0.787 if momentum falters. Key levels:
| Scenario | Price Target | Key Level |
|---|---|---|
| Bullish | $1.00 | Break $0.929 |
| Neutral | $0.85–$0.92 | Hold 20-day MA |
| Bearish | $0.65 | Lower Bollinger Band |
BTCC's Ava emphasizes, 'MACD momentum and ETF news support upside, but traders should watch volume at $0.94.'
